CBMS Survey of Departmental Responses to COVID
By: David Bressoud @dbressoud

David Bressoud is DeWitt Wallace Professor Emeritus at Macalester College and Director of the Conference Board of the Mathematical Sciences
Every five years, starting in 1965, the Conference Board of the Mathematical Sciences (CBMS) has surveyed mathematics departments across the United States to gather data on course offerings and enrollments. Every five years, that is, until 2020. Last June we realized that Fall 2020 would be atypical. Furthermore, given how stressed department chairs would be, we worried about getting a decent response. We decided to postpone the 2020 survey to 2021. In its place, we sent out a very short survey to determine how the department was responding to the pandemic. The results of that survey are now in. While the survey included two-year colleges as well as departments of statistics, I am restricting this report to departments of mathematics with four-year undergraduate programs. The full report can be found at http://www.ams.org/profession/data/cbms-survey/cbms2020.
Most departments of mathematics, 53%, said that most of their classes were online only, with a further 30% teaching most classes as a combination of online and face-to-face (Figure 1). When taught online, they were almost always taught with the opportunity to meet synchronously. The use of online versus face-to-face instruction varied by institution type and size. Of doctorate-granting departments, 59% reported that most classes were taught online only, while this was true of only 42% of undergraduate-only departments. Size was an even bigger factor. For universities with undergraduate enrollments over 20,000, 84% had most of their classes online only. For those with undergraduate enrollments under 5,000, only 37% taught most classes online only, while 35% offered most of their classes in a combination of online and face-to-face. Public versus private also made a difference. At public universities, 66% taught most classes online only. At private colleges and universities, it was only 42%.

Figure 1. Distribution of departments reporting each format used by most classes in Fall 2020, reported by type of institution.
The mode of instruction appeared to have a direct impact on class size (Figure 2). Retaining face-to-face instruction during the pandemic required reducing class size. On the other hand, if the instruction is entirely online, it is relatively easy to expand class size. The greatest determinants were highest degree offered and the size of the institution. Among those colleges offering only a Bachelors's degree (BA/BS only), 55% reduced class sizes, 23% increased them. At PhD-granting departments, 36% reduced class sizes and 33% increased them. For those with under 5,000 undergraduates, 52% reduced class size and 20% increased. With over 20,000 students, 28% reduced class size and 47% increased it. Across all departments, 27% cancelled some classes, a percentage that was fairly consistent across all types of departments.

Figure 2. Percentage of departments reporting change in class sizes for Fall 2020.
Many departments wound up teaching fewer students in Fall 2020 than they had in Fall 2019 with 27% seeing a departmental enrollment reduction of at least 10% (Figure 3). Mid-sized universities, between five and ten thousand students, were hit particularly hard with 70% reporting an enrollment reduction of at least 5%. The largest universities were relatively immune to this effect, with only 23% seeing a reduction of at least 5%.
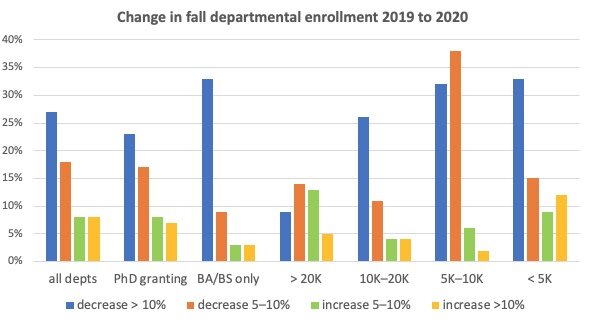
Figure 3. Percentage of departments reporting at least 5% change in undergraduate enrollment in mathematics classes from Fall 2019 to Fall 2020.
These reductions in enrollment were reflected in faculty retention and hiring (Figure 4). Across the board, 11% of departments reported reducing the number of full-time faculty and 17% reduced the number of part-time faculty. The effect was particularly pronounced at universities with enrollments between ten and twenty thousand where 19% reduced full-time faculty and 25% reduced part-time faculty. The largest universities, those with enrollments over 20,000, were the only ones in which the number of places that increased full-time faculty was close to the number that decreased these positions. A large fraction of these universities, 30%, also saw an increase in the number of part-time faculty.

Figure 4. Percentage of departments reporting change in number of full-time or part-time faculty, Fall 2020.
Two-thirds of departments, 66%, reported providing training in online teaching over the summer. This was reflected in the assessments of how well-prepared faculty were for teaching online. For spring 2020, only 22% of departments felt that over half their faculty were prepared to teach online. By this past fall, that had increased to 89% of departments, percentages that were remarkably consistent across all types of departments.
A majority of departments, 57%, reported giving faculty a choice of the mode of instruction they would provide. An overwhelming majority, 75%, stated that their faculty preferred to teach face-to-face. While that was their preference, it was not necessarily an option. An equally strong majority, 76%, reported that, in the fall, faculty had access to adequate equipment and technology for teaching online.
Students had a choice whether to meet their classes online or face-to-face in 42% of departments (Figure 5). It is concerning that 20% of departments found that their students did not have the necessary equipment and internet connections to participate in online classes. This rose to 42% for baccalaureate-only departments.

Figure 5. Percentage of departments reporting that students had a choice of formats and percentage reporting lack of adequate access among students to equipment or internet for online courses.
The experiences of this past fall have had an impact on department attitudes toward online and distance learning, 35% are considering offering more distance learning courses, 26% are considering a broader range of such courses, and 39% are reporting increased faculty interest in teaching online courses (Figure 6). The percentages are lower at smaller institutions and noticeably higher at the largest. At universities with enrollments over 20,000, 46% are looking at offering more distance learning, 37% a broader range of courses, and 51% reporting increased faculty interest in teaching these courses.

Figure 6. Percentage of departments reporting increased interest in distance learning.
The greatest impact of the pandemic will undoubtedly be faculty familiarity with the tools of online learning and an increased willingness to use them. We can expect a more diverse selection of distance learning courses and much greater use of online teaching even once we return to primarily face-to-face instruction. As in many cases, the pandemic has accelerated a trend that was already underway.
But another more disturbing trend seems to be accelerating, the divergence between instruction in large public universities and small private colleges. The former are putting more of the instruction online and switching to part-time faculty. Face-to-face instruction in small classes with full-time faculty is increasingly the exclusive preserve of liberal arts colleges. But many of them are being hit hard by reductions in enrollment, undoubtedly driven by the high cost of such education. Elite colleges are thriving. Others are struggling. As in so much else, the COVID-19 pandemic is creating greater gulfs between the privileged and the disadvantaged in our society.
Acknowledgement: The 2020 CBMS survey of departmental responses to the COVID-19 pandemic was conducted with funding from the National Science Foundation, #1916764, administered by AMS and supported by Westat. The principal investigators are Ellen Kirkman, Rikki Blair, and Tom Barr.
Download the list of all past Launchings columns, dating back to 2005, with links to each column.