The 2021 CBMS Survey of Departments in the Mathematical Sciences
By: David Bressoud @dbressoud

David Bressoud is DeWitt Wallace Professor Emeritus at Macalester College and Director of the Conference Board of the Mathematical Sciences
The 2021 CBMS Survey of Undergraduate Programs in the Mathematical Sciences in the United States is now at departments that were selected on the basis of a stratified random sample. The survey was postponed from 2020 because last year was so unusual (but a short survey assessing responses to the pandemic was sent out, see “CBMS Survey of Departmental Responses to COVID,” April 2021 Launchings). This year’s survey provides an opportunity to assess the longer-term repercussions of the COVID-19 pandemic, and I strongly encourage every department selected for this survey to complete it so that we can get an accurate picture of what is happening. This column will explain some of the new features of the 2021 survey and also look at some of the historical data.
I need to begin by acknowledging the people responsible for this survey. For the fourth time, Ellen Kirkman has worked on this survey. Beginning with the 2010 survey, she and Rikki Blair have led the development of the surveys. AMS began handling the grants that pay for these surveys in 2000. For the 2021 survey, Tom Barr at AMS has taken over from Jim Maxwell as their lead person. The National Science Foundation is underwriting the cost of this endeavor as they have for every CBMS survey, this year through grant #1916764.

2021 CBMS Survey leadership: Ellen Kirkman, Rikki Blair, and Tom Barr.
The 2021 survey asks questions about the lingering effects of what happened in 2020–21. We ask about changes, favorable or unfavorable, in faculty attitudes toward online instruction. We also inquire about continuing changes to the availability of online offerings, either as a hybrid offering in conjunction with face-to-face meetings or as an alternative to traditional in-person classes. We explore the challenges of online instruction, questioning whether online learning has presented either a moderate or significant challenge for assessment, maintenance of academic integrity, grade inflation, creation or maintenance of community among faculty and students, maintenance of quality instruction, engagement of students, or employment of active learning.
One significant change is that the questions in 2015 that explored how departments use introductory statistics to satisfy college math requirements now also ask broadly about “pathways” courses, defined to be a single course or course sequence that enables students to complete a college-level gateway mathematics or statistics course that is aligned to students' academic and/or career goals within one academic year. If they are offered, we ask about strategies used in these courses. In addition, 2015 questions that asked what types of technology are being used have been replaced with questions that explore how technology is being used in both pathways and introductory statistics classes.
A significant addition consists of questions probing whether, and if so how, the department is responding to issues of diversity, equity, and inclusion. Are there faculty- or student-led discussions of these issues? Have there been policy or programmatic changes in response to increased awareness of problems?
Historical data
The CBMS surveys originated with a U.S. Department of Education study conducted in 1960 to collect enrollment numbers for courses in undergraduate mathematics. Beginning in 1965 and then every five years thereafter, the Conference Board of the Mathematical Sciences has repeated this survey, gradually adding more questions to gain a richer understanding of the state of undergraduate mathematics education. The grants were run and the surveys published by CBMS until 1985 when MAA took over that responsibility. It was passed on to AMS in 2000. From the start of CBMS’s involvement, the surveys encompassed departments of mathematics, applied mathematics, or statistics in both four- and two-year programs.
Because course enrollment numbers were the focus of the original surveys, these provide the most comprehensive long-term trends (Figures 1, 2, and 3). Figure 1 shows the growth in mathematics classes by category: precollege (eg. elementary or intermediate algebra), intro (eg. college algebra, precalculus, finite mathematics), calc level (single or several variable calculus, linear algebra, differential equations), and advanced (anything beyond calc level). Statistics is shown separately in Figure 2. While departments of statistics were surveyed from the beginning, the CBMS survey did not distinguish between statistics taught in a department of mathematics (stats-math) and that taught in a statistics department (stats-stat) until 1990. Statistics taught in other departments has not been counted.

Figure 1. Course enrollments in undergraduate mathematics in four-year programs by category.

Figure 2. Course enrollments in undergraduate statistics in four-year programs. Beginning in 1990, enrollments in statistics departments have been recorded separately.
Figure 3 shows the course enrollments at two-year colleges. CBMS ran a special survey of two-year colleges in the fall of 1966 and has coordinated the two-year college surveys with those at four-year institutions ever since. Probably the most noticeable aspect of this graph is the sharp decline in precollege mathematics between 2010 and 2015, a decline of 32% from over 1.1 million to shy of 800,000. Work on the Pathways programs began just before 2010. This has enabled many students to move directly or at least more quickly into credit-bearing courses. It will be particularly interesting to see what happens to precollege enrollments in 2021.

Figure 3. Course enrollments in mathematics in two-year programs by category.
Figure 4 shows the changes in the number of bachelor’s degrees awarded by departments in the mathematical sciences. Separate options were not recorded until 1975. The growth during the 1960s was phenomenal. Equally impressive was the collapse during the 1970s. Some but by no means all of that can be explained by the growth of computer science departments. While the growth in total enrollments continued during the 70’s, we can see the substantial drop in enrollment in advanced courses during that decade. Calc level peaked in 1990, then decreased. Majors peaked several years later, then saw their decline. I have noted elsewhere the tremendous and broad interest in STEM careers ignited after the economic collapse of 2008 (see the NCES data in Figures 5 and 6). That is reflected in the 2015 CBMS numbers.
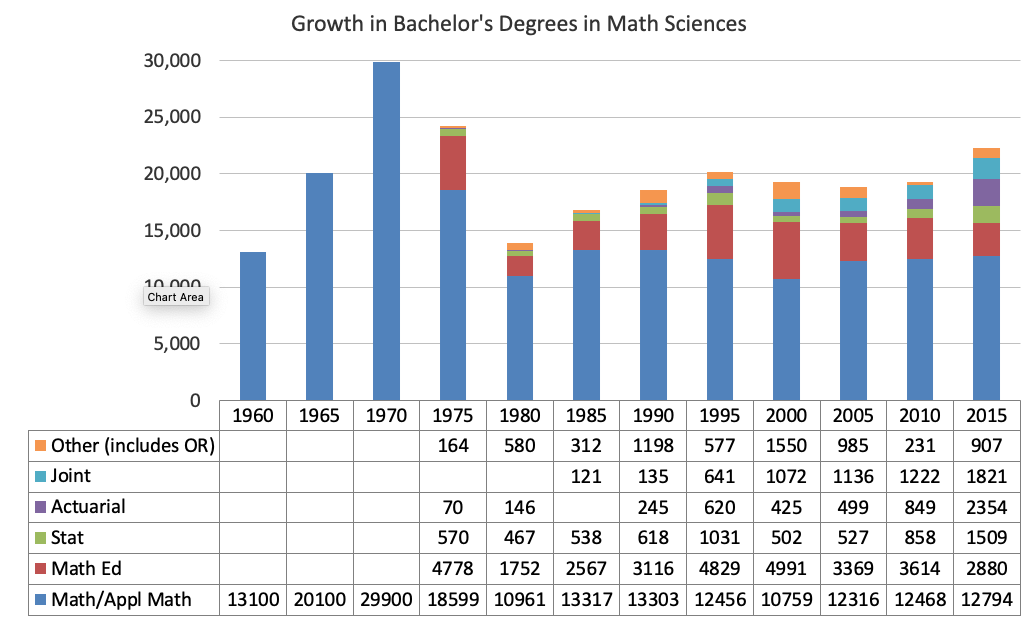
Figure 4. Number of Bachelor’s degrees awarded by departments in the mathematical sciences. Separate categories were not recorded until 1975.

Figure 5. Fraction of Bachelor’s degrees awarded in engineering, physical science, computer science, or mathematical science. Data from U.S. Dept. of Ed. National Center for Education Statistics.
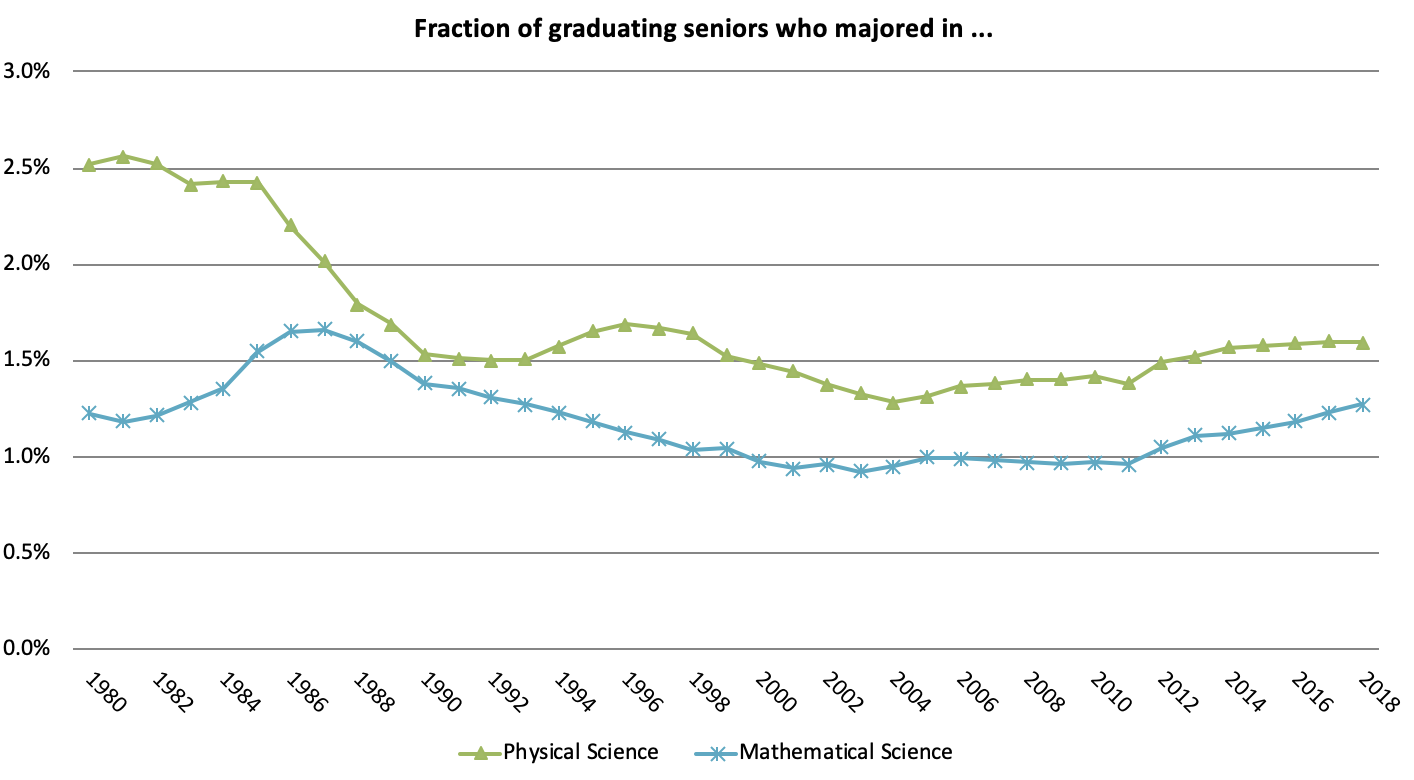
Figure 6. Fraction of Bachelor’s degrees awarded in physical science or mathematical science. Data from U.S. Dept. of Ed. National Center for Education Statistics.
We have these data because department chairs have generously contributed time and resources to responding to the surveys. We hope that this will continue, especially that now, more than ever, we need to be kept abreast of how the profession may be changing.
Download the list of all past Launchings columns, dating back to 2005, with links to each column.