The decline in high school calculus
By: David Bressoud @dbressoud

David Bressoud is DeWitt Wallace Professor Emeritus at Macalester College and former Director of the Conference Board of the Mathematical Sciences
In May of this year, the U.S. Department of Education’s National Assessment of Educational Progress (NAEP) released the results of their transcript study for the high school graduating class of 2019. It held some surprises. First is that only 15.8% of high school graduates, 579,000 students, had completed a course of calculus. That is down from 19.3%, 671,000 students, in 2013. And this was before the sharp decline due to the COVID pandemic. It is well below the 750,000 that I had estimated for 2016 based on growth to 21%. The second big surprise was the sharp decline in the number of Black students who had calculus on their transcript: 6.2% or 28,400 in 2019, down from 9.0% or 41,600 in 2013.
There is a lot of data in these transcript studies. I will use this column to explore what might be happening.
NAEP has collected transcript data roughly every ten years for many decades, with breakdown by race/ethnicity starting in 1990. In addition, there is transcript data from the high school class of 2013, collected by the U.S. Department of Education’s High School Longitudinal Study that began in 2009 (HSLS:09) (Figure 1 and Table 1).
There are sharp decreases across the board for every category except “two or more races.” Part of the loss among Black students might be explained by the growing popularity of this designation. In 2009 only 26,763 public high school graduates choose this characterization. By 2013 this was up to 65,569. In 2019 it reached 102,720.
A broader look at the data reinforces the notion that rather than focusing on race/ethnicity, the right place to look is socio-economic status (SES) or the percentage of students on free or reduced lunch, which serves as an indicator of the financial resources likely to be available to the high school.

Figure 1.
Only the HSLS:09 study of 2013 recorded SES. It reported the following percentages of graduates who had completed a calculus course:
Lowest fifth: 9.0%
Middle three-fifths: 16.2%
Highest fifth: 36.7%
Clearly, SES is a big factor, but this does not show how it has shifted.
The NAEP data record the percentages by the fraction of students on free or reduced lunch (Table 2).
This is informative because it shows that the percentages went up everywhere except in schools with 51–75% free and reduced lunch, what the Department of Education labels as “mid to high poverty” schools. 73% of Black students are in high schools with at least 51% free and reduced lunch.
Many college faculty still question the usefulness of high school calculus, despite the strong evidence that a good grade on an AP Calculus exam really does indicate that calculus has been learned (see AP Examined from December 2010 and AP Calculus: What We Know from June 2009). Even without this evidence, high school calculus draws on the mathematics learned in algebra, trigonometry, and precalculus, strengthening student understanding of these topics; familiarizes students with the basic concepts of calculus; and indicates what should be more highly qualified teachers. For those students who are headed toward a STEM career, access to calculus in high school does confer an advantage. To those who have, more is given, and the gap is widening.
AP Calculus numbers
It is instructive to look at the number of AP calculus exams taken from 2009 to 2021 (Table 3).
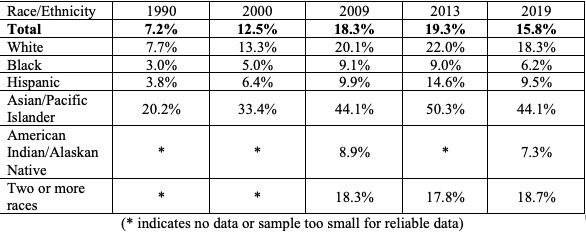
Table 1: Percentage of high school graduating class with calculus on transcript.
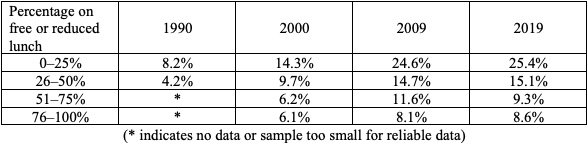
Table 2: Percentage of high school graduating class with calculus on transcript by free and reduced lunch status.
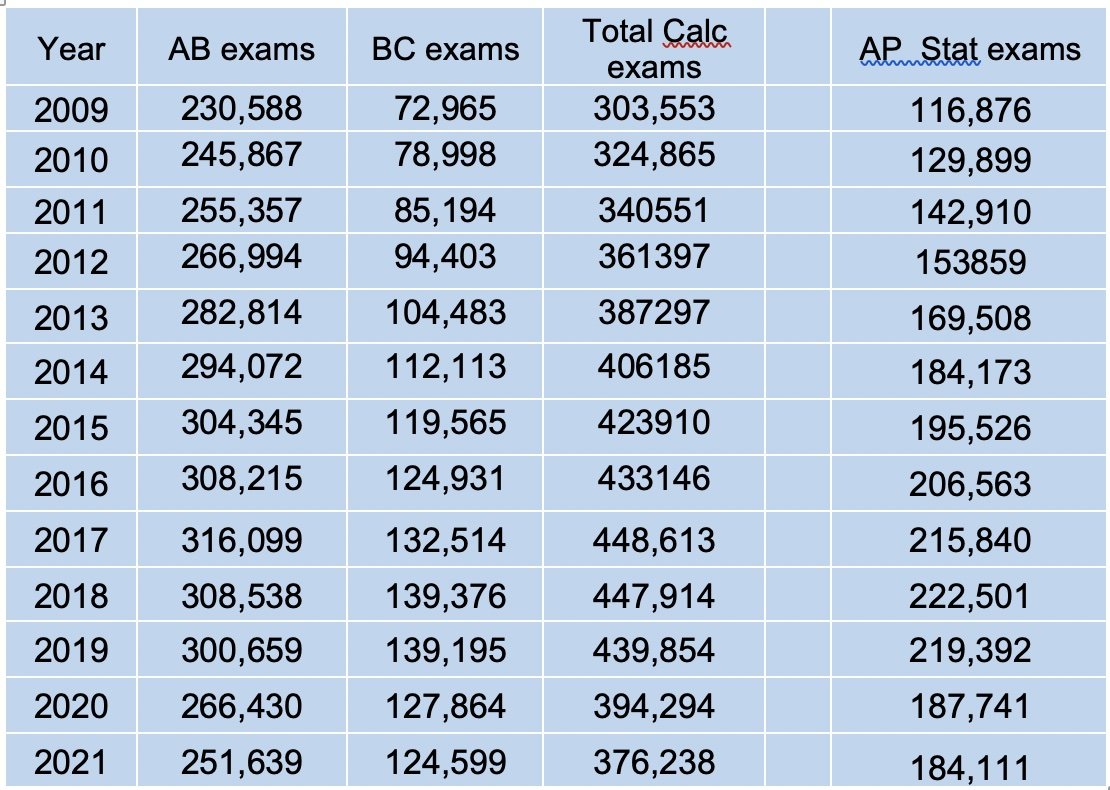
Table 3: AP Calculus and Statistics exams taken from 2009 to 2021.
We see that the number of exams peaked in 2017, two years before the NAEP transcript study. The dramatic decrease from 2019 to 2021 is almost certainly due to the effects of the COVID-19 restrictions. But what is interesting is that even as the number of students taking calculus in high school decreased from 2013 to 2019, the number of exams increased.
As explained in my March column “Calculus, College Admissions, and the High School Curriculum,” calculus on a high school transcript does confer an advantage when applying to the most selective colleges and universities. These increases suggest that it is no longer enough to have taken “calculus.” It needs to be AP calculus. The high percentage of calculus students who take the BC exam, over 25% (Table 4) indicates increasing pressure that the calculus one takes in high school needs to be BC calculus.
One observation is that there must be a lot of double counting of AB and BC Calculus exams. While a student cannot take both exams in the same year, a wealth of individual examples points to a common practice of requiring AB Calculus as a prerequisite for BC Calculus.

Table 4: AP Calculus exams as percentage of all students with calculus on their transcript.
I need to point out that this is entirely against the intent of BC Calculus. BC Calculus was supposed to be the first year of calculus for high school students who were ready to engage in a full college-level course. AB Calculus was introduced in 1969 as a less demanding introduction to the subject, but it still covers much more than the first semester of a college-level course including most of the techniques and applications of integration that are typically covered in the second semester. This leaves the remainder of the BC syllabus with far less than a full-year high school course. There are high schools that greatly supplement the BC syllabus when it is used for a second year of calculus. I fear that in too many schools students in BC calculus are mostly retreading what they already learned the previous year. If, as so often happens, they then enroll in Calculus I in college, they will have spent three years going over the material of the first semester of calculus.
Statistics
A reasonable assumption is that statistics has siphoned away many of the students who previously would have taken calculus. The NAEP transcript data does show a steady increase in the percentage of high school graduates with statistics on their transcripts, surpassing calculus in 2019 with 16.7% over calculus at 15.8%:
1990: 1.0%
2000: 5.7%
2000: 13.0%
2009: 16.7%
However, AP Statistics also peaked before the 2019 NAEP transcript study (Table 3). We do see a strong increase in statistics among students in schools with at least 50% on free or reduced lunch, but also among students in the wealthiest schools (Table 5). There might have been some students who were directed away from calculus toward statistics, but the NAEP data also show that precalculus has continued to grow across all high schools (Table 6). It is an intriguing observation that in the wealthiest high schools, calculus is far more popular than statistics. In the schools with 0–25% free and reduced lunch, calculus is taken by 25.4% of students whereas statistics is only taken by 16.8% (Tables 2 and 5). In all other schools, statistics outweighs calculus.
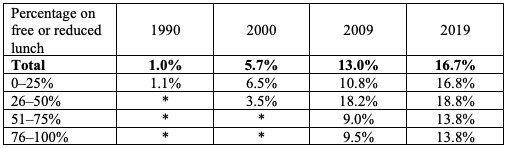
Table 5: Percentage of high school graduating class with statistics on transcript by free and reduced lunch status

Table 6: Percentage of high school graduating class with precalculus on transcript by free and reduced lunch status
Personal Reflections
In high schools with significant numbers of students who aspire to admission into highly selective colleges and universities, there continues to be enormous pressure to get these college-bound students into calculus, in most cases AP Calculus, and if at all possible through BC Calculus even if that means two high school years spent studying single variable calculus. This last is a significant waste of instructional opportunity and a serious problem. There also seems to be a loss of calculus programs in less well-resourced schools, an equally serious problem when students who are prepared for and will need calculus for their intended career are denied access to it while in high school.
I see the growth of statistics as a good sign. It is useful for everyone and can serve as a beneficial alternative for students who have been turned off more traditional mathematics. Especially for students who have had no interest in pursuing a STEM career, statistics can broaden their appreciation for the mathematical sciences, revealing its relevance to their lives in ways that traditional mathematics may have failed.
References
Dalton, B., Ingels, S.J., and Fritch, L. (2018). High School Longitudinal Study of 2009 (HSLS:09) 2013 Update and High School Transcript Study: A First Look at Fall 2009 Ninth-Graders in 2013 (NCES 2015-037rev). U.S. Department of Education. Washington, DC: National Center for Education Statistics. https://nces.ed.gov/pubs2015/2015037rev2.pdf
National Center for Education Statistics. (2022). Concentration of Public School Students Eligible for Free or Reduced-Price Lunch. Condition of Education. U.S. Department of Education, Institute of Education Sciences. https://nces.ed.gov/programs/coe/indicator/clb/free-or-reduced-price-lunch
National Center for Education Statistics. (2022). Percentage of public and private high school graduates who completed selected mathematics courses in high school, by selected student and school characteristics. Table 225.40 in Digest of Education Statistics. https://nces.ed.gov/programs/digest/d21/tables/dt21_225.40.asp
National Center for Education Statistics. (2022). Public high school graduates, by race/ethnicity. Table 219.30 in Digest of Education Statistics. https://nces.ed.gov/programs/digest/d21/tables/dt21_219.30.asp
Download the list of all past Launchings columns, dating back to 2005, with links to each column.